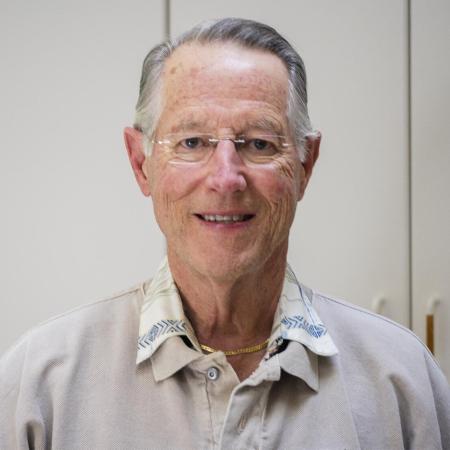
Alumni profile: Peter Banwarth
Peter Banwarth (M.S. ’12, Advisor: Tom Dick) is an epidemiologist and public health data scientist with the Benton County Health Department in Oregon. He has developed models to guide county health policies on testing as well as safety and health measures for employees and the public to minimize infections and deaths in Corvallis and nearby areas. To keep the public informed about COVID-19 models and public health initiatives, Banwarth has presented his work with Oregon health departments for audiences at OSU and the Corvallis City Council. Banwarth's modeling suggests that the restrictions Benton County implemented during the shutdown phase have been successful in reducing the spread of the virus. Prior to joining the mathematics graduate program at OSU, Banwarth received an undergraduate degree in economics and a master's degree in statistics from Stanford University.
The Mathematics Department Media Committee recently sat down with Peter for an interview. The following has been edited for length.
Q: Why did you choose to study in the math department at OSU?
I started as an undergraduate, I studied economics, and then had an opportunity to do a master's in statistics, so I moved a little more abstract, a little way from applied. And then when I decided to move back to Oregon, I was thinking about what I enjoy doing, one of those things is teaching, I really like teaching. And so I did a little thinking and I said, there are a lot of opportunities to teach mathematics, a lot more opportunities to teach math than there are to teach economics. And so I moved to Salem at the time, and Oregon State is close to Salem, and I'm from Corvallis, so had the opportunity to start the math program at OSU with the plan to get a degree so that I could teach math.
Q: What is one favorite OSU Math department memory?
I really enjoyed the first year of my master's program, diving into the core classes with my fellow students who are also diving in, and just working through the homework together, and up at the chalkboard three of us, or four of us, and talking about the problems and figuring them out. So that's one of my favorite memories, not necessarily a specific one, but I definitely enjoyed the camaraderie.
A specific memory I enjoyed was I took a class with Elise Lockwood on teaching, I don't remember exact title, but it was about statistics and teaching of probability and statistics. And we each developed a little module project that we presented to the class, and so I developed one based on actually an experiment I did when I was in eighth grade science, but added a statistics flair and got to present that to the class, and then submitted it to a statistics website and actually got it published there. So that's one of my favorite memories.
Q: What is it that you do?
A lot of what I do is really collaborative learning, I would say. I learn from the folks I work with, their side of things, and then I help them learn the mathematical and the data side of the work that they're doing.
I monitor more overall health measures for the county and work with our community partners to try to improve the health of our community members, and my role is to really provide the data to help them set mileposts and understand where we are, and then monitor any changes.
I have an opportunity to do a lot of different things in my job. So I've worked on some pretty intensive programming projects, developing EpiModel of disease. I've worked on some data science, data management applications to bring in large quantities of data and organize it so it's easily visualized. I work on presenting data to different groups in different ways, everything from a community group that has no background in public health or data analytics, to other Epis around the state. And I also get to work with a really great team of professionals who are focused on extending the benefits of living in Benton County to all our community members, and not just the ones who come in privileged.
Q: What led you to your career and how did the Math department at OSU prepare you for it?
I was teaching as a lecturer at OSU, mathematics, and also had a baby on the way so I thought about the trajectory of my career, and as an adjunct lecturer at OSU, as much as I enjoyed it, I knew it wasn't incredibly stable. So when this position came along for the epidemiologist at the county, I decided, Hey, that's an interesting job. I always like learning something new, I knew I would learn a lot about the public health side of things, and they were also pretty clear that they were looking for someone who is really comfortable both interpreting, but also explaining, data and statistics in a public health lens, and so it was just a good opportunity for me to take my skill set and use it to build more knowledge and really ground myself in the community that I wanted to live in.
Q: What are you currently working on?
For the past year I have been working with public health and the health department in the county on our COVID 19 response.
Currently I monitor our daily trends in COVID-19 cases. I've developed and maintain a public dashboard so that our community can see what the pandemic looks like at a local level. I am, along with some other team members, we provide recommendation and advice to our local K-12 schools as they provide education to our students in this current climate, I have developed some modeling to, earlier on before, when it was more questions than answers about what the pandemic would look like, I developed modeling to help us plan for different contingencies based on how we might respond from a policy standpoint, how the disease might develop. I also partner with OSU, especially College of Science and College of Public Health and Human Services on the OSU TRACE project for monitoring COVID-19 among the OSU community, and how that affects and interacts with the larger Benton County community.
The most common question I get as an epidemiologist is, “Well, are students part of Benton County? Do we count students in our population? Do we count them in our health statistics?" And so I would encourage you to find some space to put this in the media, or the interview, is OSU students are absolutely a part of our community, they are included in our population, so the population of Benton County is 93,000 people, and that includes all the OSU students. We include them in our health statistics, and they are as much a part of our community as anybody else who lives, works, learns, or plays in Benton County. Whether someone is here visiting for a single meal, or living their whole life, they're all part of the public health community, and we do our best to include them all in our community wellbeing.
Q: You were interviewed as part of OSU’s Daily Barometer series “19 COVID-19 Stories” back in May 2020. We are a year later - How has your work changed since then and how do you feel about the state of things now compared to then?
In May 2020 there was so much uncertainty about what was happening and about how the virus may spread. May was about the point where the initial spread of the disease seemed to slow a little bit, at least in Oregon and in Benton County, and so there was a lot of uncertainty about, how are we weathering this? Is it going to get a lot worse in the fall and the winter? Didn't know much about the disease, didn't know specifically how it spread, how much of it was aerosol, how much of it was droplet, how much of it was surface. The medical treatments were not as refined, and so individuals who've got a severe disease were at higher risk of death. And at the same time in Benton County we were seeing maybe two cases a week, maybe five cases a week. So we did not actually have a lot to do from the standpoint of case investigation, or actual disease control, we were trying to figure out. How are we going to prepare for what may or may not come down the road later.
So we did a lot of work on seeing how the disease might progress throughout the next full year, developing some models to say, well, what would happen if we maintain these very high restrictions? What would happen if we relaxed the restrictions completely, things like that. In the past year, we now have a much better sense of what to expect, given a certain level of cases, what to expect coming, depending on a response, whether the case rate will grow or shrink. So at the same time, in April we were seeing a minimum of five cases a day, so instead of five cases a week, if we had only five cases in a day, we were very fortunate. During January we were seeing as many as 40 cases a day, so fortunately we have brought that down, but things were starting to trend back up in April.
So the county response overall is now we're putting a lot in public health, our two roles really are now case investigation. We have four full-time case investigators focused just on COVID 19 that we've added in the past year, and also our vaccine rollout, and our vaccine efforts, which really started in January and have ramped up to include everyone over the age of 12.
Q: What might people be surprised to learn about your profession and what you do?
Epidemiology is a lot more than infectious disease, communicable disease. So when people think about epidemiologists, they think about someone like Dr. Anthony Fauci, who is an epidemiologist, in addition to being a medical doctor and the head of infectious disease at US NIAID. But most epidemiologists actually work on non-communicable disease, so the epidemiologists who just spend their careers trying to figure out the reason for higher cancer rates, for example, in a certain population, whether it's geographic, or other connections between the population. And epidemiology has really begun to recognize how far back the determinants of health go, everything from income to the zip code where a person was born, to what racial or ethnic group they identify with. And so epidemiology is really now trying to figure out, how do we incorporate all that different information to understand what changes a person's opportunity to live a healthy life, and what can we do to create the conditions so that everyone has the opportunity to live a healthy life.
As public health, like most other disciplines, has become more data oriented, that's where epidemiology has really expanded into those other pieces, the use of data to understand those determinants of health requires data and analytics backgrounds.
Q: What do you do for fun or hobbies?
I really like mountain biking. I try to mountain bike every week in McDonald Forest. I also like gardening. So I've got a vegetable garden started, and I also have blueberries and some fruit trees planted. And my kid, who's five, he really loves to be out in nature and to ride his bike. So a couple of times a week we either go riding their bikes, or I just got a couple of kayaks, and so now we've started exploring the waterways around Salem, and as the weather gets better, we'll go for more hikes and go camping as well.
Q: What advice or “wise words” would you like to give people?
The biggest advice I would give would be, always look for opportunities to learn from the people around you. We all bring different backgrounds, different experiences, different views and different skill sets, and it's amazing what you can learn from someone when you enter with a sense of curiosity, and you honor your worldview, but you also are able to really try to see things from someone else's perspective. A lot of mathematics feels very black and white, but mathematics takes place in society and society is very colorful. And so just being open to the possibility and the opportunity to learn from other people, I think is satisfying and very professionally advantageous.